There are several ways to customize the look and behavior of reports in the Reports (New) section of Barnestorm software. These customizations will be applied to the grid at the bottom of the screen before running a report. Here we will go over a few of these customizations that you can apply.
1. Sorting

Sorting is a way or organizing the results of your data based on the results of a particular column. Sorting can be ascending or descending. The example here shows a numeric column, Total Referred, sorted descending. If the results were sorted ascending, then the results would have started with a 1, then the 9 and so on. To sort a column, simply click the column header or the box at the top that says "Total Referred" and you will see a sort indicator appear. Click the header again to change the direction of the sort.
2. Grouping

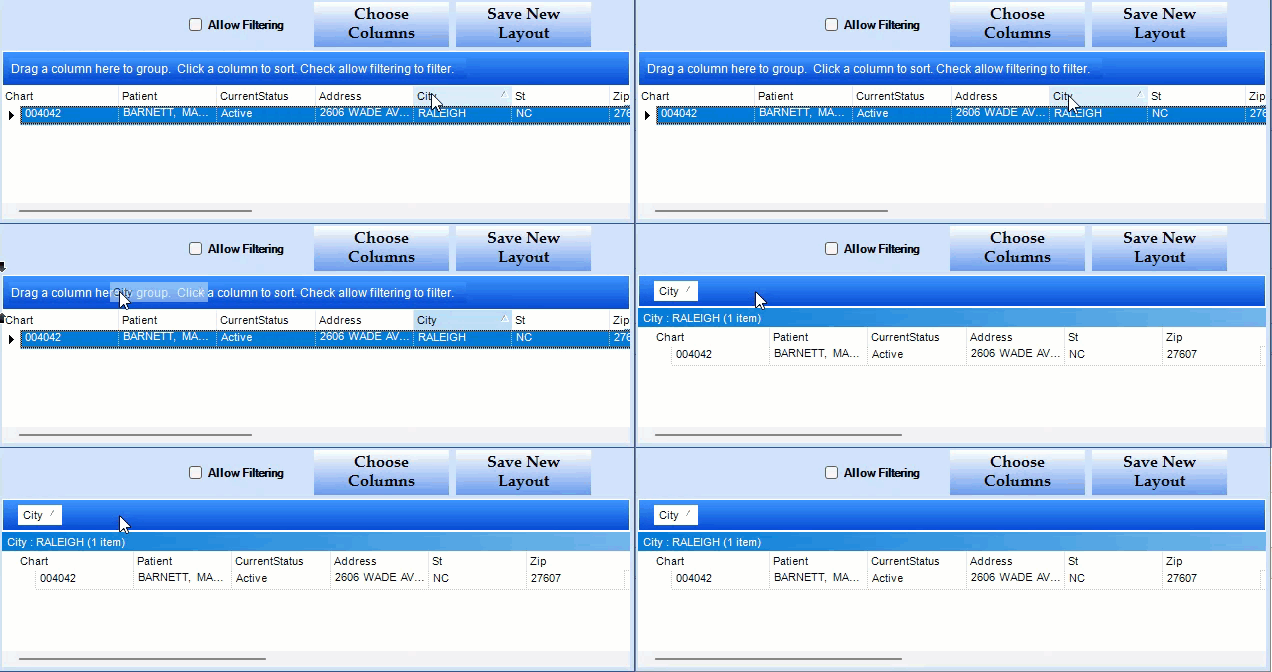
Grouping is a way of putting similar information together on the report. In this example, the report is grouped on the Program column. This means all the results with the same program number will be put together on the report. In other words, all the results with program 03 will be put together, and results with program 01 will be put together, and so on for all of the programs.
3. Filtering
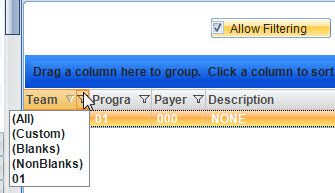
Filtering is a way of removing unwanted results from your report. We provide some standard filters for all of our reports, that are shown in the middle of the screen. But, sometimes, these may not be the items that you would like to use to filter. So, we have provided a way for you to filter on any item within the report. To enable filtering, check the Allow Filtering checkbox. The filter icon will appear on every column header. Find the column that you wish to filter and click the filter icon. This will present you with a drop down of possible filtering values. In the example, only Team 00 and Team 10 are shown in the results so, they are default options that you have to filter upon. You can click one of these values, or create a custom filter which can be applied to the report. To create a custom filter, click (Custom).
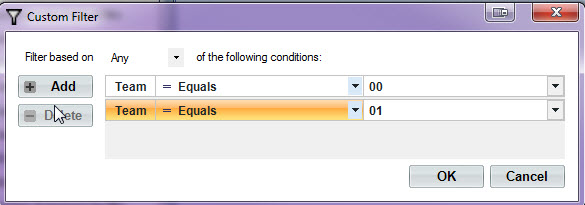
The filter dialog box will be displayed. Here you can choose an operand and a value for that operand. In this example, since we are filtering on the Team column. We are going to see only the results that have a team of 00 and 01. As many filters can be applied as you would like by clicking Add. Change the Filter based on to Any if you want the results of all applied filters. To apply your filter, click OK.
4. Choosing columns
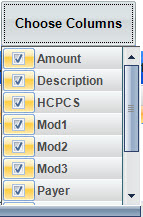
Choosing columns is a way of adding or removing columns from the report to customize the display. Checked columns are the ones that are already on the report and unchecked ones are ones that are available for the report. Simply check an item to add it to the report, and uncheck it to remove it from the report. To bring up and hide the column chooser click Choose Columns.
5. Resizing columns - Occasionally the information in a column will be too wide to fit within the bounds of the column. To resize a column, position your mouse cursor at the border of two column headers. The mouse cursor will change to the resizing icon and you can left click and hold and move the column to the left or the right, depending on which column you would like to resize.
After you have applied some custom properties to your report, you can save the new layout as a new report. To do so, click Save New Layout.
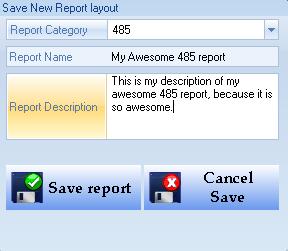
Here you can give the report a category, which will be where the report appears in the menu on the left. You can apply a custom name to the report and description. Click Save Report to save the report or click Cancel Save to return to the main screen. After you save a report, the report is automatically loaded up for you to run.
Add Your Comments
|
Last Modified:Wednesday, January 18, 2023
Type: HOWTO
Rated 5 stars based on 1 vote
Article has been viewed 5,279 times.
|